Machine and Deep Learning Algorithms E-Learning Training Certified Teachers Exam Quizzes Assessments Test Exam Live Labs Tips Tricks Certificate.
Read more.
Bulk discount
No discount
1 Piece
€192,39€159,00
2% Discount
2 Pieces
€188,54€155,82/ Piece
3% Discount
3 Pieces
€186,62€154,23/ Piece
4% Discount
4 Pieces
€184,69€152,64/ Piece
5% Discount
5 Pieces
€182,77€151,05/ Piece
10% Discount
10 Pieces
€173,15€143,10/ Piece
15% Discount
25 Pieces
€163,53€135,15/ Piece
20% Discount
50 Pieces
€153,91€127,20/ Piece
Make a choice
Officieel erkend testcentrum Online of fysiek examen afnemen
Bekroonde e-learning Inclusief proefexamens en 24/7 begeleiding
ISO 9001 & 27001 werkwijze 2.500+ organisaties gingen u voor
Maatwerk & gratis nulmeting Altijd op het juiste niveau gestart
Product description
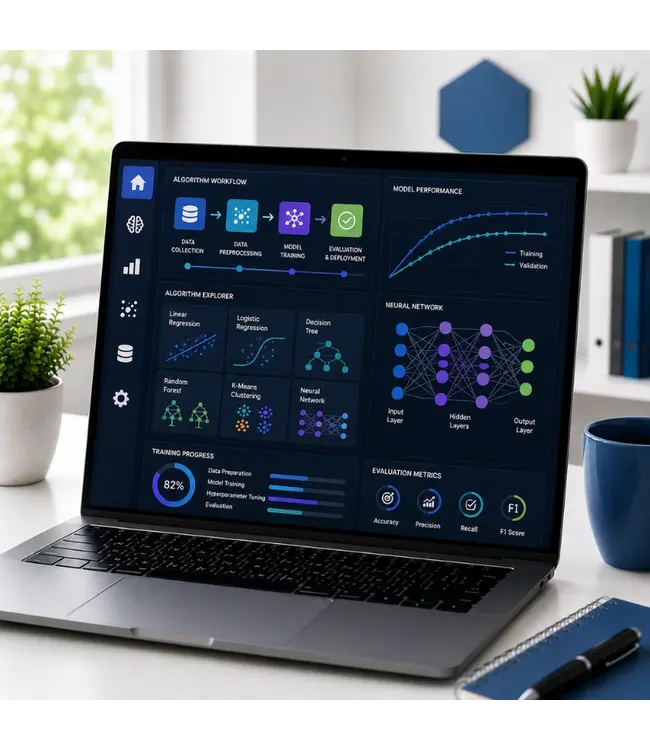
Machine and Deep Learning Algorithms E-Learning
1 year 24/7 access to rich interactive videos, voice, progress monitoring through reports and tests per chapter to test your knowledge directly. After the course, you will receive a certificate of attendance.
Demo Machine and Deep Learning Algorithms Training
Why choose this course?
Machine Learning (ML) and Deep Learning (DL) are the foundations of artificial intelligence that is increasingly used in various sectors such as healthcare, finance, technology and more. Understanding the algorithms that drive these systems is essential for anyone active in the world of data science and AI.
This course provides a comprehensive introduction to the basics of machine learning and deep learning, focusing on the algorithms that drive these powerful technologies. You will learn the fundamental concepts and get hands-on experience building and implementing algorithms that can be applied to real business challenges.
What you will learn:
Basics of Machine Learning and Deep Learning: Understand the differences, applications and capabilities of ML and DL.
Key Algorithms in Machine Learning: Learn about regression, classification, clustering and other commonly used algorithms.
Deep Learning Algorithms: Gain insight into neural networks, convolutional networks (CNNs), recurrent networks (RNNs) and more advanced deep learning algorithms.
Evaluation of Models: Discover techniques for testing, evaluating and improving machine learning and deep learning models.
Practical applications of ML and DL: Learn how to apply algorithms in various scenarios, from image and speech recognition to prediction and data analysis.
Who should participate?
This course is ideal for:
Data scientists who want to deepen their knowledge of machine learning and deep learning.
Software developers who want to integrate AI and ML into their applications.
Machine Learning enthusiasts who want to build a thorough knowledge of the underlying algorithms.
Business Intelligence professionals who want to learn how to leverage machine learning algorithms for better business decisions.
IT professionals who want to develop or implement AI solutions for their organisation.
Course content
Balancing the Four Vs of Data: The Four Vs of Data
Course: 40 Minutes
Course Overview
Overview of the Four Vs
The Importance of Volume
The Importance of Variety
The Importance of Velocity
The Importance of Veracity
The Relationship Between the Four Vs
Variety and Data Structure
Validity and Volatility
Finding Balance in the Four Vs
Use Cases
Extracting Value from the Four Vs
Exercise: Describe the Four Vs of Big Data
Data Driven Organizations
Course: 1 Hour, 15 Minutes
Course Overview
Data Driven Organizations
Decision Making
Analytic Maturity
Analytic Roles
Data Source Priority
Facets of Data Quality
Power BI Data Visualization
Missing Data
Duplicate Data
Truncated Data
Data Provenance
Exercise: Use Informatica Data Quality
Raw Data to Insights: Data Ingestion & Statistical Analysis
Course: 54 Minutes
Course Overview
Statistical Analysis
Data Correction
Outlier Detection
Data Architecture Pattern
Data Ingestion Tools
Kafka and Apache NiFi
Apache Sqoop Ingest
Ingest Using WaveFront
Exercise: Detecting Outliers and Ingesting Data
Raw Data to Insights: Data Management & Decision Making
Course: 57 Minutes
Course Overview
Data-driven Decision Making Framework
Loading Data into R
Preparing Data
Data Correction Approach
Data Correction Using Simple Transformation
Data Correction Using Deductive Correction
Distributed Data Management
Data Analytics
Data Analytics Using R
Predictive Modeling
Exercise: Correcting and Modelling Data
Tableau Desktop: Real Time Dashboards
Course: 1 Hour, 8 Minutes
Course Overview
Introducing Real Time Dashboards
Creating Real Time Dashboards with Tableau
Build a Tableau Dashboard
Real Time Dashboard Updates in Tableau
Organizing Your Tableau Dashboard
Formatting Your Tableau Dashboard
Interactive Tableau Dashboard
Tableau Dashboard Starters
Tableau Dashboard Extensions
Tableau Dashboards and Story Points
Sharing your Tableau Dashboard
Exercise: Creating a Tableau Dashboard Starter
Storytelling with Data: Introduction
Course: 47 Minutes
Course Overview
Storytelling Process
Interpreting Context
Analysis Types
Who, What, and How of Storytelling
Visualization for Storytelling
Graphical Tools for Data Elaboration
Storytelling Scenarios
Storyboarding
Exercise: Visualization and Graphical Tool
Storytelling with Data: Tableau & PowerBI
Course: 57 Minutes
Course Overview
Visual Selection
Slopegraphs
Bar Charts and Types of Bar Charts
Clutter and Clutter Elimination
Gestalt Principle
Story Design Best Practices
Tools for Storytelling
Decluttering
Crafting Visual Data
Visual Design Concerns
Storytelling with Power BI
Model Visual and Tableau
Exercise: Storytelling with Power BI
Python for Data Science: Basic Data Visualization Using Seaborn
Course: 1 Hour, 7 Minutes
Course Overview
Introduction to Seaborn
Install Seaborn
Simple Univariate Distributions
Configure Univariate Distribution Plots
Simple Bivariate Distributions
Explore Different Types of Bivariate Distributions
Analyze Multiple Variable Pairs
Regression Plots
Themes and Styles in Seaborn
Exercise: Basic Data Visualization Using Seaborn
Python for Data Science: Advanced Data Visualization Using Seaborn
Course: 1 Hour, 4 Minutes
Course Overview
Searching for Patterns in a Dataset
Configuring Plot Aesthetics
Normal Distribution and Outliers
Distributions Within Categories - Part 1
Distributions Within Categories - Part 2
Analyzing Categories with Facet Grids - Part 1
Analyzing Categories with Facet Grids - Part 2
Introducing Color Palettes
Using Color Palette8
Exercise: Advanced Data Visualization Using Seaborn
Data Science Statistics: Using Python to Compute & Visualize Statistics
Course: 1 Hour, 16 Minutes
Course Overview
An Introduction to Matplotlib
Analyzing Data Using NumPy and Pandas
Visualizing Univariate and Bivariate Distributions
Summary Statistics Using Native Python Functions
Summary Statistics Using NumPy
Summary Statistics Using the SciPy Library
Correlation and Covariance
Z-score
Exercise: Compute and Visualize Statistics6 MinutesCompletedActions
R for Data Science: Data Visualization
Course: 33 Minutes
Course Overview
Using Scatter Plots
Using Line Graphs
Using Bar Charts
Using Box and Whisker Plots
Using Histograms
Using a Bubble Plot
Exercise: Data Visualization
Advanced Visualizations & Dashboards: Visualization Using Python
Course: 38 Minutes
Course Overview
Relevance of Data Visualization for Business
Libraries for Data Visualization in Python
Python Data Visualization Environment Configuration
Matplotlib Libraries for Visualization
Bar Chart Using ggplot
Bokeh and Pygal
Select Visualization Libraries
Interactive Graphs and Image Files
Plot Graphs
Multiple Lines in Graphs
Exercise: Create Line Charts with Pygal
Advanced Visualizations & Dashboards: Visualization Using R
Data Insights, Anomalies, & Verification: Handling Anomalies
Course: 46 Minutes
Course Overview
Data and Anomaly Sources
Decomposition and Forecasting
Examine Data Using Randomization Tests
Anomaly Detection
Anomaly Detection Techniques
Anomaly Detection with scikit-learn
Anomaly Detection Tools
Anomaly Detection Rules
Exercise: Detecting Anomalies
Data Insights, Anomalies, & Verification: Machine Learning & Visualization Tools
Course: 51 Minutes
Course Overview
Machine Learning Anomaly Detection Techniques
Comparing Anomaly Detection Algorithms
Anomaly Detection Using R5
Online Anomaly Detection Components
Online Anomaly Detection Approaches
Anomaly Detection Use Cases
Anomaly Detection with Visualization Tools
Anomaly Detection with Mathematical Approaches
Cluster-Based Anomaly Detection
Exercise: Detecting Anomalies
Data Science Statistics: Applied Inferential Statistics
Course: 1 Hour, 19 Minutes
Course Overview
The One-Sample T-test
Independent and Paired T-tests
Testing Hypotheses with T-tests
Loading and Analyzing a Skewed Dataset
Measuring Skewness and Kurtosis
Preparing a Dataset for Regression
Simple Linear Regression
Multiple Linear Regression
Exercise: Applied Inferential Statistics
Data Research Techniques
Course: 33 Minutes
Course Overview
Data Research Fundamentals
Data Research Steps
Values, Variables, and Observations
JMP Scale of Measurement
Non-experimental and Experimental Research
Descriptive and Inferential Statistical Analysis
Inferential Tests
Case Study of Clinical Data Research
Data Research in Sales Management
Exercise: Implement Data Research
Data Research Exploration Techniques
Course: 50 Minutes
Course Overview
Fundamentals of Exploratory Data Analysis
Data Exploration Types
Working with R
Data Exploration in R
Data Exploration Using Plots
Python Packages for Data Exploration
Data Exploration Using Python
Data Research Using Linear Algebra
Linear Algebra for Data Research
Exercise: R and Python for Data Exploration
Data Research Statistical Approaches
Course: 43 Minutes
Course Overview
Role of Statistics in Data Research
Discrete vs. Continuous Distribution
PDF and CDF
Binomial Distribution
Interval Estimation
Point and Interval Estimation
Data Visualization Techniques
Data Visualization Using R
Data Integration Techniques
Creating Plots
Missing Values and Outliers
Exercise: Statistical Methods for Data Research
Machine & Deep Learning Algorithms: Introduction
Course: 46 Minutes
Course Overview
Machine Learning Algorithms
How Machine Learning Works
Introduction to Pandas ML
Support Vector Machines
Overfitting
Exercise: Machine Learning and Classification
Machine & Deep Learning Algorithms: Regression & Clustering
Course: 49 Minutes
Course Overview
The Confusion Matrix
An Introduction to Regression
Applications of Regression
Supervised and Unsupervised Learning
Clustering
Principal Component Analysis
Exercise: Regression and Clustering
Machine & Deep Learning Algorithms: Data Preperation in Pandas ML
Course: 1 Hour, 4 Minutes
Course Overview
Data Preparation in scikit-learn
Training and Evaluating Models in scikit-learn
Introducing the Pandas ML ModelFrame
Training and Evaluating Models in Pandas ML
Preparing Data for Regression
Evaluating Regression Models
Preparing Data for Clustering
The K-Means Clustering Algorithm
Exercise: Regression, Classification, and Clustering
Machine & Deep Learning Algorithms: Imbalanced Datasets Using Pandas ML
Course: 1 Hour, 24 Minutes
Course Overview
Analyzing an Imbalanced Dataset
The RandomOverSampler
The SMOTE Oversampler
Undersampling Using imbalanced-learn
Ensemble Classifiers for Imbalanced Data
Combination Samplers
Finding Correlations in a Dataset
Building a Multi-Label Classification Model
Dimensionality Reduction with PCA
Imbalanced Learn and PCA
Creating Data APIs Using Node.js
Course: 1 Hour, 31 Minutes
Course Overview
API Prerequisites
Building a RESTful API Using Node.js and Express.js
RESTful API with OAuth
HTTP Server with Hapi.js
API Modules
Returning Data with JSON
Nodemon for Development Workflow
API Requests
POSTman for API
Deploying APIs
Social Media APIs
Exercise: Building RESTful APIs
Get started with Machine and Deep Learning Algorithms!
Learn at your own pace with interactive videos and voice commands. Test your knowledge chapter by chapter with tests to track your progress. Get hands-on skills in building machine learning and deep learning models. Get a certificate of participation upon successful completion of the course.
Specifications
Article number
137133975
SKU
137133975
Language
English
Qualifications of the Instructor
Certified
Course Format and Length
Teaching videos with subtitles, interactive elements and assignments and tests
Lesson duration
23:24 Hours
Progress monitoring
Access to Material
365 days
Technical Requirements
Computer or mobile device, Stable internet connections Web browsersuch as Chrome, Firefox, Safari or Edge.
Support or Assistance
Helpdesk and online knowledge base 24/7
Certification
Certificate of participation in PDF format
Price and costs
Course price at no extra cost
Cancellation policy and money-back guarantee
We assess this on a case-by-case basis
Award Winning E-learning
Tip!
Provide a quiet learning environment, time and motivation, audio equipment such as headphones or speakers for audio, account information such as login details to access the e-learning platform.
Heeft u vragen over dit product of hulp nodig bij het bestellen? Onze AI-chatbot is 24/7 beschikbaar, of neem contact op via [email protected] of bel +31 36 760 1019
Heeft u vragen over dit product of hulp nodig bij het bestellen? Onze AI-chatbot is 24/7 beschikbaar, of neem contact op via [email protected] of bel +31 36 760 1019
Machine and Deep Learning Algorithms E-Learning Training Certified Teachers Exam...
€192,39€159,00
Specifications
Article number
137133975
SKU
137133975
Language
English
Qualifications of the Instructor
Certified
Course Format and Length
Teaching videos with subtitles, interactive elements and assignments and tests
Lesson duration
23:24 Hours
Progress monitoring
Access to Material
365 days
Technical Requirements
Computer or mobile device, Stable internet connections Web browsersuch as Chrome, Firefox, Safari or Edge.
Support or Assistance
Helpdesk and online knowledge base 24/7
Certification
Certificate of participation in PDF format
Price and costs
Course price at no extra cost
Cancellation policy and money-back guarantee
We assess this on a case-by-case basis
Award Winning E-learning
Tip!
Provide a quiet learning environment, time and motivation, audio equipment such as headphones or speakers for audio, account information such as login details to access the e-learning platform.
Wij gebruiken functionele en analytische cookies (Google Analytics). Geen persoonsgegevens voor advertenties. Kies hieronder of beheer uw voorkeuren.
Manage cookies